
Learning From Leadership
Investigating the Links to Improved Student Learning
How principals and others exercise leadership makes a big difference in education.
July 2010

Table of Contents
Document

- Author(s)
- Kyla L. Wahlstrom, Karen Seashore Louis, Kenneth Leithwood, and Stephen E. Anderson
- Publisher(s)
- Center for Applied Research and Educational Improvement and The University of Minnesota
Page Count
334 pages
Summary
How we did this
Begun around 2005, this five-year study was among the largest of its kind at the time. It involved nine states, 43 school districts, and 180 public schools. The researchers fielded two rounds of surveys with principals and teachers. That led to survey data from almost 8,400 teachers and 475 school administrators. The research team also observed classrooms and interviewed a range of state policymakers, education leaders, and teachers. These included state legislators, school district officials, school board members, teachers, and administrators. The research also involved examination of student test scores in reading and math.
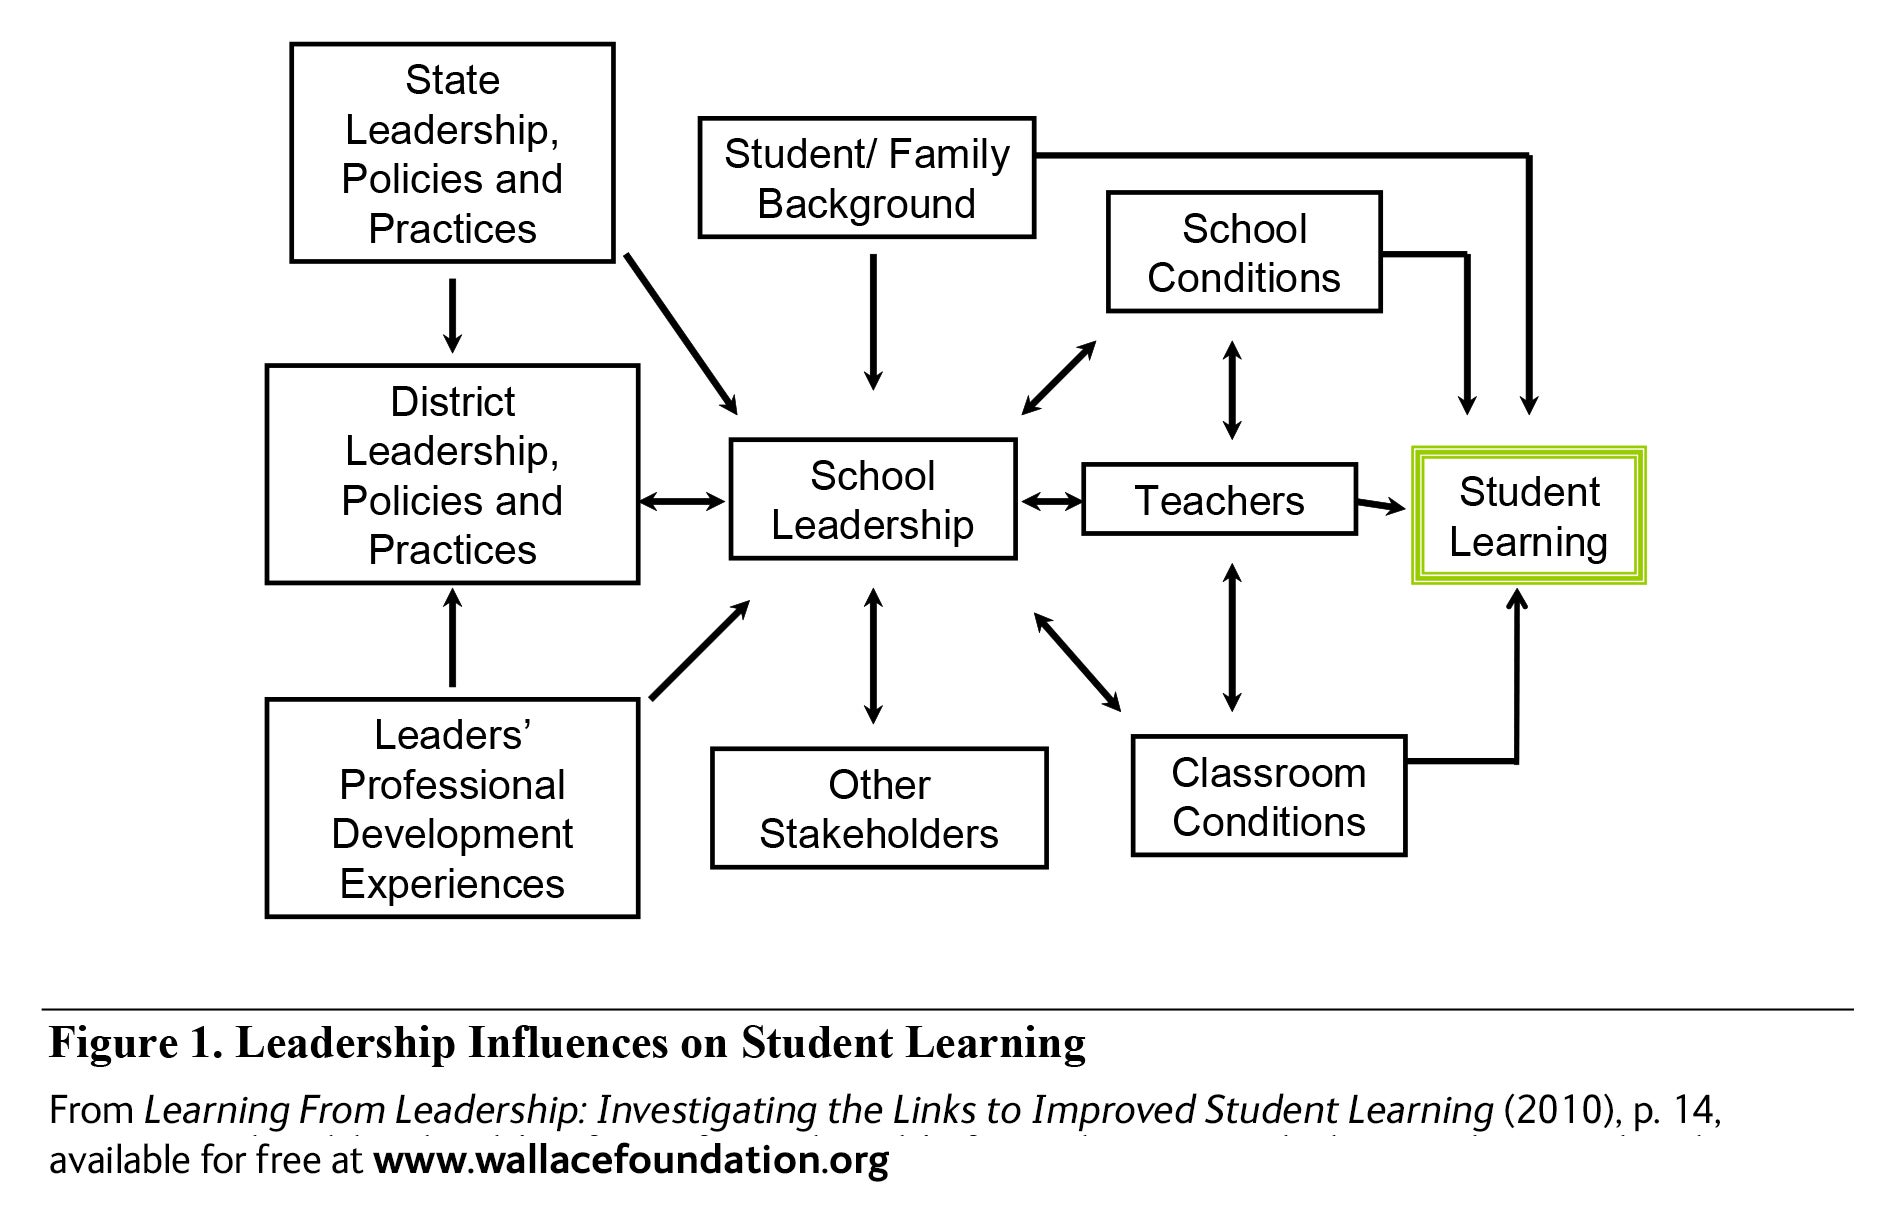
This report explores the role of leadership in shaping high-quality public schools. It looks at a variety of people with a leadership role in education, including state policymakers and school districts officials. It devotes special attention, though, to principals and teachers.
Principals are central to effective leadership, the authors say. The way they lead has an impact on student achievement. How principals motivate teachers and set up working conditions for them is crucial to making sure that the impact is positive.
This does not mean that effective leadership leaves all decision-making to the principal. In fact, the opposite may be true. Schools with better student achievement are more likely to have a culture of shared leadership. In other words, teachers are given a major role in decision-making.
The researchers examine the path from effective principal leadership to classroom benefits. A major point along the way is the creation of a climate in which teachers work together to improve their teaching skills. Effective principals promote these "professional communities," which research links to student achievement.
What are traits of leadership that can boost instruction? Teachers and principals who were part of the study agreed that three stood out:
- Focusing the school on goals and expectations for student achievement
- Keeping track of teachers’ professional development needs
- Creating structures and opportunities for teachers to collaborate
The study also looks beyond the school building to state policymakers and school districts. One thing states can do is place less emphasis on educator compliance and more emphasis on educator support, the authors say.
One eye-catching finding regards district actions. The researchers found that districts can strengthen a principal's sense that the efforts of the principal and those surrounding the principal work well. Why does this matter? "Collective self-efficacy," as it is known, had a positive link to student test results, the research found.
Interviews with principals pointed to seven actions districts could take to develop this sense of efficacy. The authors caution that doing just one or two of the actions may not work and may even be counter-productive. Among the actions are:
- Providing schools with the necessary resources
- Setting policies that enable principals to staff their schools with the people they need
- Giving schools clear direction through such things as district-wide curricula

Why is leadership crucial? One explanation is that leaders have the potential to unleash latent capacities in organizations.
Key Takeaways
- There are many sources of leadership in schools, but principals are central.
- Schools with better student achievement are more likely to have a culture of shared leadership.
- Effective leadership creates a climate in which teachers work together to improve their teaching skills.
- School districts can foster a principal’s sense of collective self-efficacy. That could benefit student achievement.
Hear from the Experts

Materials & Downloads
Topics:
Now Viewing:
Overview
Next: Research Approach
