Contents

Learning From Leadership: Investigating the Links to Improved Student Learning

Click here to download the full report:
 Learning From Leadership: Investigating the Links to Improved Student Learning

Key Findings

  • Districts that help their principals feel more efficacious about their school improvement work have positive effects on school conditions and student learning.
  • Principals who believe they are working collaboratively toward clear and common goals—with district personnel, other principals, and teachers in their schools—are more confident in their leadership.
  • District size is a significant moderator of district effects on school-leader efficacy; the larger districts, the less the influence.
  • School level also is a significant moderator of district effects on school-leader efficacy, with districts having larger effects on elementary than secondary school leaders.

Introduction

One of the most powerful ways in which districts influence teaching and learning is through the contribution they make to feelings of professional efficacy on the part of school principals. Evidence justifying this claim is provided by quantitative and qualitative studies. Principal efficacy provides a crucial link between district initiatives, school conditions, and student learning.

Our quantitative evidence was useful in addressing three issues:

  • the extent to which district leadership and district conditions influenced principals‘ sense of efficacy for school improvement
  • the influence of principal efficacy on: (a) principals‘ leadership practices, (b) learning conditions in their schools, and (c) student learning
  • the extent to which personal and organizational characteristics moderate the influence of principals‘ efficacy on student learning.

Given the significant contribution that principal efficacy makes to school effectiveness, it is important to know what districts can do to build such efficacy. While our quantitative evidence provides a general response to this question, our qualitative evidence offers much more detailed answers.

Prior Evidence

Relevant theory. Efficacy is a belief about one‘s own ability (self-efficacy), or the ability of one‘s colleagues collectively (collective efficacy), to perform a task or achieve a goal. It is a belief about ability, not actual ability. Bandura, self-efficacy‘s most prominent theorist, claims that:

    People make causal contributions to their own functioning through mechanisms of personal agency. Among the mechanisms of agency, none is more central or pervasive than peoples‘ beliefs about their capabilities to exercise control over their own level of functioning and over events that affect their lives (1997a, p. 118).

Most leader-efficacy studies have been influenced by Bandura‘s sociopsychological theory of self-efficacy (e.g., 1982, 1986, 1993, 1997a, 1997b). In addition to defining the meaning of self-efficacy and its several dimensions, this body of work identifies the effects of self-efficacy feelings on a leader‘s behavior, and the consequences of that behavior for others. This line of theory also specifies the direct antecedents of self-efficacy beliefs and the mechanisms through which such beliefs develop.

Efficacy beliefs, according to this theory, have directive effects on one‘s choice of activities and settings, and they can affect coping efforts once those activities are begun. Such beliefs determine how much effort people will expend and how long they will persist in the face of failure or difficulty. The stronger the feelings of efficacy, the longer the persistence. People who persist at subjectively threatening activities that are not actually threatening gain corrective experiences that further enhance their sense of efficacy. In sum, "Given appropriate skills and adequate incentives…efficacy expectations are a major determinant of peoples‘ choice of activities, how much effort they will expend and how long they will sustain effort in dealing with stressful situations (Bandura, 1997a, p.77).

Efficacy beliefs, according to Bandura (1993), develop in response to cognitive and affective processes. Among the cognitive mechanisms, and potentially relevant to our research, are perceptions about how controllable or alterable one‘s working environment is. These are perceptions about one‘s ability to influence, through effort and persistence, what goes on in the environment, as well as the malleability of the environment itself. Bandura (1993) reports evidence suggesting that those with low levels of belief in how controllable their environment is produce little change, even in highly malleable environments. Those with firm beliefs of this sort, through persistence and ingenuity, figure out ways of exercising some control, even in environments that pose challenges to change. This set of efficacy-influencing mechanisms may help to explain some results of our research on district conditions and initiatives that foster principal efficacy.

Self-efficacy beliefs also evolve in response to motivational and affective processes. These beliefs influence motivation in several ways: by determining (a) the goals that people set for themselves,170 (b) how much effort they expend how long they persevere in the face of obstacles, and (c) their resilience in the face of failure. Also, motivation relies on discrepancy reduction as well as discrepancy production. That is, people are motivated both reduce the gap between perceived and desired performance and to set themselves challenging goals which they then work hard to accomplish. They mobilize their skills and effort to accomplish what they seek.171 Such beliefs, we surmise, also are likely to be influenced by some of the conditions that principals experience in their districts.

Previous research. Pointing to the similarity of efficacy and self-confidence, McCormick claims that leadership self-efficacy or confidence is likely the key cognitive variable regulating leader functioning in a dynamic environment. "Every major review of the leadership literature lists self-confidence as an essential characteristic for effective leadership" (2001, p. 23). That said, we know very little about the efficacy beliefs of leaders in particular,172 and even less about the antecedents of those beliefs. According to Chen & Bliese (2002), most organizational research has focused on the outcomes of efficacy beliefs, with much less attention to their antecedents. Pescosolido (2003) has argued, in addition, that the antecedents of leaders' self efficacy (LSE) and leaders' collective efficacy (LCE) may well differ. For example, district leadership practices and organizational conditions may predict collective efficacy more immediately than they predict self efficacy because leadership practices relate only indirectly to the more proximal antecedents of individual efficacy, such as role clarity and psychological states.173

Prior evidence about the antecedents of both self- and collective-leader efficacy warrants several conclusions. First, no single antecedent has attracted much attention from researchers. Second, the most frequently studied antecedents—leader gender, leaders‘ years of experience, level of schooling, and compliance with policy or procedures—have not found much evidentiary support, by any conventional social science standard. Third, what evidence there is about the impact of various antecedents on leader efficacy suggests that results are either mixed or not significant. Finally, as far as we could determine, there has been very little effort to understand district influences on school-level leader efficacy.

New Evidence

Method174

Instruments. The overall sampling strategy for our first round of surveys is described in the methodological appendix. Evidence for this sub-study was provided by responses to 58 items on the first round of teacher surveys and 58 items from the first round of principal surveys. Principal survey items measured LCE (4 items), LSE (6 items), district conditions (30 items), and district leadership (18 items). We measured three additional variables with the teacher survey: school leadership (20 items), class conditions (15 items), and school conditions (21 items). The distribution of variables to be measured across the two surveys is based on judgments about which respondents (teachers or administrators) were most likely to have the authentic information about each variable. This procedure also reduced the threat of same-source bias in our results.

Previous efforts to develop adequate measures of leader-efficacy beliefs have failed to produce instruments completely suitable for our purposes. Gareis and Tschannen-Moran (2004), for example, describe many of these previous efforts and report results of their research on the validity and reliability of:

  • a promising, vignette-based measure of individual leader efficacy developed by Dimmock and Hattie (1996);
  • a 22-item adaptation of a measure of collective teacher efficacy originally developed by Goddard et al. (2000b); and
  • a 50-item adaptation of a measure of individual teacher efficacy (eventually reduced to 18 items) initially developed by Tschannen-Moran and Hoy (2000).

These authors reported disappointing results of their tests of the factor structures of the first two instruments, but the third measure proved to be more satisfactory in terms of its factor structure and its construct validity. Three factors emerged: self-efficacy for handling managerial aspects of the job, instructional leadership tasks, and moral leadership tasks.

Because we focused in our larger study on leaders‘ influence on student learning, we incorporated into our principal survey the six-item scale measuring feelings of selfefficacy about instructional leadership tasks. We interpreted these items to be measuring efficacy for school improvement. Beginning with the stem To what extent do you feel able to, the six items included the following:

  1. Motivate teachers?
  2. Generate enthusiasm for a shared vision of the school?
  3. Manage change in your school?
  4. Create a positive learning environment in your school?
  5. Facilitate student learning in your school?
  6. Raise achievement on standardized tests?

We developed a new four-item scale for the principal survey to measure leaders‘ collective efficacy beliefs about school improvement. Beginning with the stem To what extent do you agree that, these items included the following:

  1. School staffs in our district have the knowledge and skill they need to improve student learning?
  2. In our district, continuous improvement is viewed by most staff as a necessary part of every job?
  3. In our district, problems are viewed as issues to be solved, not as barriers to action?
  4. District staff members communicate a belief in the capacity of teachers to teach even the most difficult students.

Previous studies of school-leader efficacy have measured the effects of various demographic variables, but without much effort to explain why such variables might influence sense of efficacy. Few demographic variables have been shown to have a significant influence on leader efficacy. Personal characteristics measured in our study include leader race/ethnicity, gender, years of experience as a school administrator, and years of experience in one‘s current school. We also measured a handful of organizational characteristics plausibly related to leader efficacy including school and district size, school level, and number of different principals in the school over the past 10 years.

We collected data on student achievement from school websites. These websites provided school-wide results from state-mandated tests of language and mathematics at several grade levels from 2003 to 2005. We averaged results across grades and subjects in order to increase the stability of the scores. We then estimated a change score, the average change in each school from 2003 to 2005, and recorded the annual achievement score for each of the three years. This score was the proportion of students in each school achieving at or beyond the proficient level on the states‘ tests.

Analysis. We aggregated individual teachers‘ responses to the teacher survey to the school level and then merged them with principals‘ responses to the school administrator survey. We used SPSS to calculate means, standard deviations, and reliabilities (Cronbach‘s alpha) for scales measuring variables of interest to this study. We conducted five types of analysis: (1) we calculated Pearson product correlations to estimate the strength of relationships between variables in the model; (2) we used standard multiple regression to determine the effects of a specific variable that differs from the effects of other independent variables (e.g., the differing effects of LSE and LCE on school conditions); (3) we used hierarchical multiple regression was to examine the effects of particular variables or sets of variables on the dependent variable, after controlling for the effects of other variables (e.g., how the effects of district conditions on principal efficacy are moderated by district size); (4) we computed a t-test to determine the significance of leader gender; and (5) we used analyses of variance (one way ANOVA) to determine the significance of school level and leaders‘ race/ethnicity.

We used LISREL to test a model of the causes and consequences of school-leader efficacy. This path analytic technique allows for testing the validity of causal inferences for pairs of variables while controlling for the effects of other variables. We analyzed data using the LISREL 8 analysis of covariance structure approach to path analysis and maximum likelihood estimates.175

Nature of the Evidence

Here we were motivated by questions about (1) district antecedents of school leaders‘ efficacy, and possible differences in the antecedents of individual as compared with collective leader efficacy, (2) consequences of school-leader efficacy for leader behavior, as well as school and classroom conditions, and (c) effects of leader efficacy on student learning. We also examined the moderating effect of a handful of demographic variables.

Table 2.2.1 reports the means, standard deviations, and scale reliabilities for responses to the teacher and principal surveys. These data are based on responses from 96 schools and administrators (an 83% response rate) and 2,764 teachers (a 66% response rate).

Table 2.2.1
Means, Standard Deviations, and Scale Reliabilities for Variables Measured (N = 96)


Mean

SD

Reliability

Number Items

Leader Collective Efficacy-LCE

4.801

.82

.85

4

Leader Self-efficacy-LSE

4.032

.60

.92

6

District Conditions176

4.78

.72

.92

30

District Leadership177

4.80

.85

.89

18

School Leadership178

4.55

.52

.95

20

School Conditions

4.10

.46

.83

21

Classroom Conditions

4.69

.25

.60

15

Rating scales: 1. 1=Strongly Disagree to 6= Strongly Agree for all but the following variable.
2. Leader Self-Efficacy 1=Very Little to 5=Very Great.

Analyses reported below include a series of correlations and regressions followed by a path model. Our data do not permit us to make strong claims about cause and effect relationships. Nonetheless, we use the language of "effects" throughout as an indication of the nature of the relationships in which we were interested.

District Antecedents of School-Leader Efficacy

District leadership. As Table 2.2.2 indicates, our aggregate district leadership variable is strongly related to LCE (.61) and significantly but moderately related to LSE (.32). Among the four dimensions included in our conception of district leadership, the strongest relationship with LCE is Redesigning the organization (.61) followed by Developing people (.55), Managing the instructional program (.53) and Setting directions (.42). With LSE, the strongest relationship is with Managing the instructional program (.33) followed by Redesigning the organization (.28), Developing people (.26) and Setting directions (.22).


Results of a standard regression analysis show that our aggregate measure of district leadership (using the adjusted R) explains 8% of the variation in LSE, half of which is accounted for by Managing the instructional program; it also explains 40% of the variation in LCE, of which significant contributions are made by Redesigning the organization (9%) and Managing the instructional program (4%).

District conditions. All eight sets of district conditions are significantly related to leader efficacy, strongly so with LCE. The strongest relationship with LCE is the district‘s expressed Focus on quality (.66), followed, in order, by District culture (.61), Targeted improvement (.61), Relations with schools and stakeholders (.58), Emphasis on teamwork (.57), Use of data (.52), Job-embedded professional development for teachers (.40), and Investment in instructional leadership at the district and school levels (.51). We consider the nature and significance of this last district condition in greater detail later in this section, since it is a center-piece in the improvement efforts of many districts.

Relationships between district conditions and LSE are generally weaker, although still statistically significant. The strongest relationship here is with Emphasis on teamwork (.45), Focus on quality (.39), District culture (.38), Use of data (.35), Jobembedded professional development for teachers (.35), Relations with schools and stakeholders (.35), Targeted improvement (.31), and Investment in instructional leadership (.23).

Standard regression analyses indicate that the aggregate measure of district conditions explains 19% of the variation in LSE and 56% of the variation in LCE. Among the eight sets of conditions included in our district variable, significant contributions to explained variation in LSE were made by Emphasis on teamwork (18% of variation), District culture (13%), Focus on quality (12%), Relations with schools and stakeholders (11%), Data use (11%), Job-embedded professional development for teachers (10%), Targeted improvement (9%), and Investment in instructional leadership (5%). For LCE, the contributions to overall explained variation were: Focus on quality (42%), Targeted improvement (36%), District culture (36%), Relations with schools and stakeholders (33%), Emphasis on teamwork (31%), Use of data (26%), Investment in instructional leadership (25%), and Job-embedded professional development for teachers (15%).

Effects of Leader Efficacy on Leader Behavior, School and Classroom Conditions

Table 2.2.3 reports correlations between LSE, LCE, an aggregated measure of efficacy and leader behavior (in the Combined column), school conditions, and classroom conditions. The strongest relationships are between School conditions and Aggregated efficacy (.46) followed closely by the relationship between Classroom conditions and Aggregated efficacy (.40). Correlations between School leadership and both Aggregated efficacy and LSE are comparable (.30 and .32). LSE has substantially higher correlations with School leadership than does LCE. Correlations between LSE and the four separate dimensions of leadership are roughly similar, ranging from a low of .25 (Developing people) to a high of .39 (Setting directions); for LCE, the range is between .14 (Managing the instructional program) and .23 (Redesigning the organization).


Standard regression equations were used to estimate the "effects" of LSE, LCE, and an aggregate measure of efficacy on leader behavior as well as school and classroom conditions. The aggregate efficacy measure explained 9% of the variation in leader behavior; LSE explained 7%; and LCE had no unique effect. Both forms of efficacy combined explained more variation in School (19%) and Classroom (14%) conditions than either did separately; when examined separately, LSE and LCE explained roughly the same amount of variation in School conditions (4 and 8%), but only LCE explained any significant amount variation in Classroom conditions (7%).

Effects of Leader Efficacy on Student Achievement

Table 2.2.4 reports correlations between alternative estimates of student achievement and our three leader-efficacy measures. LSE is not significantly related to any of the estimates of student achievement. However, there are consistent and significant relationships with each year‘s annual achievement scores (% of students achieving at or above the proficient level) for our other two efficacy measures. Two of the three annual achievement scores are significantly related to LCE (.33, .29). All three annual achievement scores are significantly related to our aggregate efficacy measure (.28, .24 and .25).


Results of a regression analysis indicate that neither LCE alone, LSE alone, or an aggregate efficacy measure account for significant variation in the three-year mean student achievement change score. Leader efficacy, however, does explain significant variation in annual achievement scores. The aggregate efficacy measure and LCE explain comparable amounts of variation in achievement scores for 2003 (7 and 8%), and 2004 (5 and 7%). In 2005 only the aggregate efficacy measure explains significant variation in student annual achievement scores (5%). LSE alone had no significant explanatory power.

Moderating Variables

The variables we designated as moderators have potential effects on the relationship between district leadership, district conditions, and leader efficacy. Potentially, they may also moderate the relationship between leader efficacy and conditions in the school and classroom, as well as student achievement.

Our results indicate that some potential moderators had no influence on either set of relationships. This was the case for Leader gender, Experience, and Race/ethnicity, so we do not consider them further. On the other hand, District size, School size, School level, and Number of principals in the school over the last 10 years were significant moderators of the relationship between efficacy and conditions in the class and school, along with student achievement. District-leader efficacy relationships were unaffected by any of our potential moderators.

To estimate the effects of the four remaining variables on efficacy, we entered both types of leader efficacy, as well as the combined efficacy measure, into a series of regression equations, adding District size, School size, School level, and Number of principals in the school over the last 10 years. As a group, these moderators:

  • increased the variation in leader behavior explained by both sources of efficacy combined from 9% to 19%, by LSE alone from 9% to 19%, and by LCE alone from 3% to 16%
  • increased the variation in school conditions explained by both sources of efficacy combined from 20% to 34%, by LSE alone from 11% to 25%, and by LCE alone from 18% to 34%
  • increased the variation in class conditions explained by both sources of efficacy combined from 15% to 30%, from LSE alone from 8% to 22%, and from LCE alone from 14% to 30%
  • increased the variation in student annual achievement scores explained by both sources of efficacy from 8% to 14%

The moderators did not add to the variation in student achievement explained by LSE. School level and District Size contributed unique variation to many of these relationships and should be considered the most powerful of the moderators included in this study. Both of these moderators depressed the strength of the relationships in which they were significant. In other words, the contributions of both LSE and LCE to most of the relationships with which they were associated were muted by increased district size and in secondary as compared with elementary schools.

The Causes and Consequences of School Leaders’ Efficacy Beliefs: Testing a Model

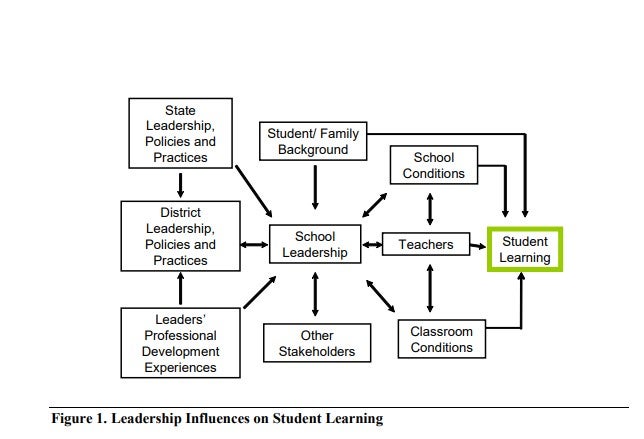
Figure 5 summarizes the results of testing a model of the causes and consequences of leader efficacy beliefs using path modeling techniques (LISREL). The model is an acceptable fit with the data (RMSEA = .00, RMR = .03, AGFI = .93 and NFI = .97). It indicates that the most direct "effects" (standardized regression coefficients) of district leadership are on the creation of those district conditions believed to be effective in producing student learning (.77); these district leadership effects account for 60% of the variation in district conditions. District conditions, in turn, influence aggregate school leader efficacy (.68); 46% of the variation in leader efficacy is explained by the effects of district conditions.

School leader efficacy is moderately associated with school conditions (.22). Aggregate leader efficacy explains 14% of the variation in leader behavior and 57% of the variation in school conditions in combination with leader behavior, with most of this variation attributable to LCE. The model suggests both direct effects of school conditions on student learning (.44) and indirect effects through classroom conditions (.88); school conditions explain 58% of the variation in class conditions. The model as a whole explains 17% of the variation in student achievement.

Most of these results seem reasonable, the exception having to do with classroom conditions. Our analysis produced a non-significant and negative direct relationship between class conditions and student learning. We have no firm explanation for this surprising result, but the marginal reliability of the scale used to measure classroom conditions (alpha = .60) may provide part of the answer.


Figure 5: Modeling the Relationship among Variables Related to Leader Efficacy


Analyses of our quantitative data can be summed up as follows:

  • The effects of district leadership on principals, schools, and students are largely indirect, operating through district conditions.
  • District leaders help to create conditions that are viewed by school leaders as enhancing and supporting their work.
  • All four dimensions of district leadership were moderately to strongly related to principal efficacy (arguing for district leaders‘ adoption of a holistic approach to their own practice).
  • The greatest effect of district leaders will be the outcome of engaging in all four sets of practices in a skillful manner.

District conditions had larger effects on principals‘ collective efficacy than on their individual efficacy—providing some confirmation for Chen and Bliese's (2002) expectation that such differences would likely exist. This expectation is based on the relatively direct influence of organizational conditions on collective efficacy, with less direct influence on individual efficacy. Common to both types of efficacy, however, is the strong influence of the district‘s focus on student learning and the quality of instruction, as well as district culture. These mutually reinforcing district conditions seem likely to attract the collective attention of school leaders to the district‘s central mission.

Also common to both types of efficacy is our discovery that the relationships between district investments in developing instructional leadership and both types of leader efficacy were the weakest of the relationships tested. Furthermore, district investments in instructional leadership had a substantially greater influence on leaders‘ collective efficacy than on their individual efficacy. Perhaps such an investment by districts has greater symbolic than instrumental value; it signifies the district‘s commitment to improving learning more than it actually develops greater capacity for the task. This conjecture on our part certainly warrants more direct study.

We found a modest effect of a combined or aggregate measure of individual and collective principal efficacy on the leadership practices of principals, mostly accounted for by individual efficacy. There was a stronger though still moderate effect of aggregate leader efficacy on both classroom and (especially) school conditions. Collective efficacy explained most of this variation.

The relationship between principals‘ efficacy and their leadership practices or behaviors were weaker than we expected. One plausible explanation is that our measure of leadership practices did not adequately capture the consequences of different levels of efficacy (or confidence) for what leaders do and how they are perceived. These consequences may have less to do with the practices themselves and more to do with the "style" of their enactment (e.g., acting with assurance, displaying a confident attitude, remaining calm in the face of crises).

We found relatively small but significant effects of leader efficacy on student learning. The size of these effects is comparable to what others have reported about school-leader effects on learning and other student outcomes.179

The extent of principal-efficacy effects on schools and students is significantly moderated by a handful of organizational characteristics (school size, district size, school level, frequency of principal succession), but by none of the personal variables included in our study (i.e., leaders‘ gender, experience, race, or ethnicity). The moderating effects of organizational characteristics are to be expected, since district size and school size almost always "make a difference," no matter what the focus of the research is.180 Elementary schools are typically more sensitive than secondary schools to leadership influence, although previous leader-efficacy research has reported mostly non-significant effects.181 And the rapid turnover of principals has been widely decried as anathema to school improvement efforts.182 Now we have some evidence that the positive effects of leader efficacy are also moderated by school and district size (the larger the organization, the less sense of efficacy among principals).

Investments in Instructional Leadership Development: A Deeper Look

Many districts consider development of their principals‘ capacity for instructional leadership—one of the district conditions included in our measures—to be a cornerstone of their improvement efforts. In light of this, we used quantitative evidence from our second survey to understand in greater depth how districts‘ efforts to bolster principals‘ capacity for instructional leadership influence schools and students. More specifically, we asked:

  1. How do principals assess the professional development and support their districts provide?
  2. How does professional development, as principals experience it, affect principals‘ collective sense of efficacy?
  3. How is development, as principals experience it, associated with student learning?

How Do Principals Assess the Professional Development and Support Their Districts Provide?

The second survey includes a number of items reflecting principals‘ belief that district staff members were making efforts to develop their skills. We framed these items generically, in an effort to tap the respondents‘ belief that professional development and support were being provided by the district. Sample items are shown below. While in may cases we have chosen to look only at principals, rather than including assistant or associate principals, in this case we chose to include all respondents (211), since there is no reason to assume that assistant or associate principals can or do receive fewer professional development resources, and our preliminary analysis suggested that there are no significant differences between the two groups.

What becomes immediately apparent is that principals have a generally positive view of the districts‘ professional development efforts. The mean responses are, in all cases, above the midpoint, meaning that most principals agree, either slightly, moderately or strongly, that their district provides the type of professional development indicated. In addition, in no case do we find principals strongly disagreeing that their district provides them with a particular type of support.

Principals do, however, differentiate among the different categories of support and professional development expressed in the questions. The most positive view of district support occurs on three items: Most principals agree, either moderately or strongly, that district leaders:

  • encourage administrators and teachers to act on what they have learned in their professional development;
  • encourage school administrators to work together to improve their instructional leadership; and
  • work with school administrators who are struggling to improve their instructional leadership.

Principals appear to be somewhat less positive about three other indicators. Many indicate that they strongly disagree, disagree, or are uncertain that district leaders Take a personal interest in my professional development. Many also indicate that district leaders Provide quality staff development focused on priority areas only occasionally, rarely, or very rarely. They also give weak ratings to the frequency with which the district Provides opportunities to work productively with colleagues from other schools.


Figure 6: Principals’ Views of District Actions to Support Professional Growth

An additional question concerns the distribution of professional development among different kinds of schools. Using analysis of variance, we examined differences in professional development experiences among elementary, middle, and high schools, among larger and smaller schools, and among schools with more or fewer students in poverty. None of these variables appear to be significantly associated with principals‘ reports of their professional development experiences.

How Does Professional Development, as Principals Experience It, Affect Principals’ Collective Sense of Efficacy?

To explore this question, we examined professional development in the context of several other factors that might affect principals‘ sense of collective efficacy. In particular, we wished to explore the general issue of whether professional development, which we view as targeted support for leadership, is more or less important than pressure to increase achievement, which is a major component of state policy. We assumed that effective leadership may require a combination of external support and pressure. In order to address this question we developed several new scales, using the second principal survey:

  • Professional development scale. The six example items above (see Figure 6), and two additional items: How frequently do your district leaders provide feedback to school administrators about the nature and quality of their leadership? and, How frequently do district leaders encourage administrators and teachers to act on what they have learned in their professional development? were highly correlated, and we computed a composite scale using the eight standardized items (a = .88).

We conducted factor analyses for a number of additional items related to district initiatives for improvement. Of these, we selected one that seems particularly pertinent to elaborating on the findings presented earlier in this section, since it emphasizes the district‘s accountability and pressure focus. In order to examine the relative importance of targets and accountability, we computed a new scale:

  • District data use and targets scale. This factor loaded highly on items such as Our district has explicit targets beyond NCLB targets, Our district incorporates student and school performance data in district-level decisions, Our district assists schools with the use of student/school performance data, and The district uses student achievement data to determine PD needs and resources. We used an additive score of five standardized variables in this analysis, with a = .87.
  • Collective sense of efficacy (LCE). Our measure of collective sense of efficacy varied from the first survey, but it still emphasized the ability of leaders in the district to solve problems and improve student learning. Three items composed the scale for collective sense of efficacy: School staffs in our district have the knowledge and skill they need to improve student learning; In our district, continuous improvement is viewed by most staff as a necessary part of the job; and In our district, problems are viewed as issues to be solved, not as barriers to action. The alpha for this scale, using standardized variables, is .72.
  • Principal sense of efficacy scale (LSE). In addition, we wished to include a measure of individual sense of efficacy. Our measure here differed somewhat from the measure used in the first survey. In this case we focused on a longer battery of leadership competencies on which the principal rated him- or herself on a four point scale ranging from "basic" to "highly developed." This scale included 10 items, including self-rated expertise in instructional strategies, coaching, managing student behavior, developing unity and teamwork among teachers, and motivating others (a = .74).

To examine the effects of these variables on collective sense of efficacy, we used a regression model, entering the key variables identified above in a first step, and then entering potential mediators: school size, the school level (elementary/secondary), percentage of non-white students, percentage of students in poverty, and the individual‘s position (principal or assistant principal). The results are shown below in Table 2.2.5.

This table indicates that district professional development and district targets both have a strong association with collective sense of efficacy (with pressure through targeted and data-focused expectations contributing more to collective efficacy). Individual sense of efficacy also makes a significant contribution to the relatively large percentage of variance explained. The school characteristics do not achieve a significant regression coefficient, nor does the Principal/Assistant Principal variable. The regression suggests that pressure and support are important predictors of collective sense of efficacy, but that pressure may be more important than support in the form of professional development for school leaders.

How Is Professional Development, as Principals Experience It, Associated with Student Achievement?

The bottom line for judging investments by districts working to develop instructional leadership is whether such investments are linked to student achievement. We examined this issue using causal modeling. The model assumes that Professional development of school leaders (Support) and Targets and data (Pressure) are both associated, directly and indirectly, with student achievement.183

The model, which achieves a reasonable level of fit, explains approximately 7% of the variance in achievement, largely through the direct relationship assumed between collective efficacy and students‘ test scores (.23). Professional development of school leaders has an insignificant direct path coefficient with student achievement, while Targets and Data has a significant negative relationship. This unexpected finding suggests that pressure, arising from targets and an emphasis on data use, may backfire in the classroom unless it is balanced with support (in this case, through professional development), so that it works by building a strong collective leadership base in the district.

In sum, the analysis suggests that investment in the professional development of school leaders will have limited effects on efficacy and student achievement unless districts also develop clear goals for improvement. On the other hand, setting targets and emphasizing responsibility for achieving them is not likely to produce a payoff for students unless those initiatives are accompanied by leadership development practices that principals perceive as helping them to improve their personal competencies.


The Effects of District Pressure and Support on Collective Efficacy and Achievement


Figure 7: The Effects of District Pressure and Support on Collective Efficacy and Achievement R2 for

R2 for Collective Efficacy = .63
R2 for Achievement = .07
RMSEA = .268
CMin = 3.98, p = .55
NFI = .98

The findings about the importance of targets and data use, in combination with district professional development, are quite strong when moderated by principal efficacy. However, an analysis of data-use effects reported in Section 2.5, which did not use principal efficacy as a moderating variable, also reported significant data use effects on students, but only in elementary schools. Together, these analyses suggest that district data use matters, but further research will be needed before we fully understand the nature of that influence.

Implications for Policy and Practice

Four implications for policy and practice emerged from this section of our study.

  1. District leaders should consider school leaders‘ collective sense of efficacy for school improvement to be among the most important resources available to them for increasing student achievement.
  2. District improvement efforts should include, as foci for immediate attention, those eight sets of conditions which the best available evidence now suggests have a significant influence on principals‘ sense of efficacy for school improvement.
  3. Principals who believe themselves to be working collaboratively toward clear, common goals with district personnel, other principals, and teachers in their schools are more confident in their leadership.
  4. It is not enough to merely launch initiatives aimed at improving the sense school leaders have of their efficacy for school improvement. Such initiatives and the conditions on which they depend can be well or poorly implemented. It will take high-quality implementation at the district level to produce higher levels of principal efficacy.

< < Previous | Next > >

References

170. E.g., Locke & Latham (1984).

171. Bandura (1993).

172. Chemers, Watson & May (2000); Gareis & Tschannen-Moran (2005).

173. Zaccaro, Blair, Peterson, & Zazanis (1995).

174. This sub-study is reported in more detail in Leithwood & Jantzi (2008).

175. Joreskog & Sorbom (1993).

176. These conditions are described in more detail in Section 2.3.

177. For a full definition of how this variable was conceptualized, please see previous Section 1.4.

178. See previous Section 1.4 to view measures which were included from the teacher survey.

179. Hallinger & Heck (1996b); Leithwood & Jantzi (2005).

180. e.g., Lucas, 2003; Smith, Guarino, Strom & Reed (2003); and Walberg & Fowler (1987).

181. DeMoulin (1992); Dimmock & Hattie (1996).

182. Hargreaves & Fink (2006); Macmillan (1996).

183. Based on analyses not shown here, we chose not to include Individual Principal Efficacy as a mediating variable. Individual Efficacy has no significant relationship with achievement, and the more complex model explains no additional variance.