StrongNonprofits Toolkit

Data and Analysis
Financial decisions can be only as good as the data and analysis they are based on. The tools in this section will help you look at your financial information with an eye toward strategic decision making to help your organization carry out its mission over the long term.

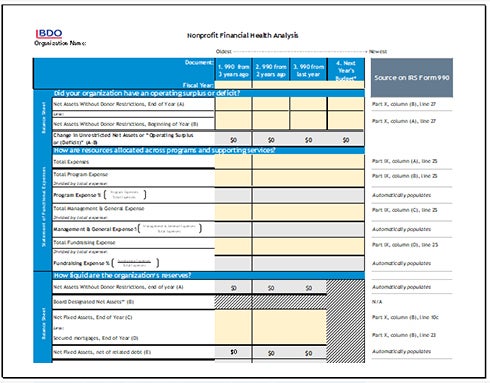
Financial Health Analysis Tool
This data-visualization tool provides a snapshot of your nonprofit's financial health based on four years of financial data and with a focus on liquidity. The package here includes the tool, video guidance and a couple of related resources.
Related Resources
Article: The Key to Long Term Financial Health: (LUNA)
This article discusses the importance of liquid reserves to an organization's financial health and sustainability.
Download Article (.pdf)
The Key to Long Term Financial Health: Liquid Unrestricted Net Assets (LUNA)
This excel-based tool can help you quickly and clearly see your current Liquid Unrestricted Net Assets.
Calculate your LUNA (.xlsx)
Tracking Key Performance Indicators
Create a customized quarterly dashboard illustrating results among a set of key performance indicators (KPIs).
Choose KPIs relevant to your organization, set targets/benchmarks for each and enter results on a quarterly basis. The template displays a table indicating whether results are better than the goal (represented by a "green" indicator), close to the goal ("yellow"), or worse than the goal ("red").

Related Resources
Models and Components of a Great Nonprofit Dashboard
This article presents guidelines, strategies and examples of effective nonprofit management "dashboard" reporting.
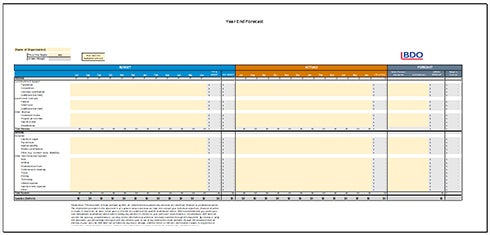
Year-End Forecast Template
Financial forecasting is an integral part of a nonprofit’s planning process and can allow for course corrections to meet your annual financial goals.
This forecasting template helps you quickly estimate how you are likely to end the year financially based on year-to-date results and other assumptions.
Understanding Audited Financial Statements
This (30-minute) video guide explains each component of the audited financial statement package, highlighting how your staff and board can use them to understand key indicators of your organization’s financial health and performance.
Related Resources
When Looking at Financials, Don't Do What Seems Most Obvious
This article discusses the importance of examining a nonprofit's unrestricted operating results to help measure the organization's financial performance over time.
Next Steps: Audit Readiness
With solid financial operations and good data, your annual audit should go smoothly—use the Audit Readiness resources to track assets and prepare for the process.
Explore the Toolkit by Topic
Budgeting
Plan, design and build your organization's operating budget to deliver on your mission effectively and sustainably
Navigating Uncertainty
Use these tools and guidance to help assess your business model risks and determine a path forward.
Cash Flow
Forecast and monitor cash flow to ensure you have the money you need when you need it
Operations
Ensure your finance office operations run efficiently and effectively
Data and Analysis
Visualize and understand what your numbers mean
Audit Readiness
Prepare for your audit and maintain audit readiness throughout the year
Governance and Strategy
Employ big-picture thinking to connect your financial resources with mission goals
GET THE LATEST UPDATES
